Food Chain Diagram
A food chain shows who eats whom — and the direction energy flows — from producers that make food from sunlight to the top predators. This diagram maker draws food chains and food webs for six ecosystems, labels each trophic level, shows how little energy reaches the top, and prints clean worksheets for science class. You can also type your own chain.
- Free to use
- No sign-up
- Runs in your browser
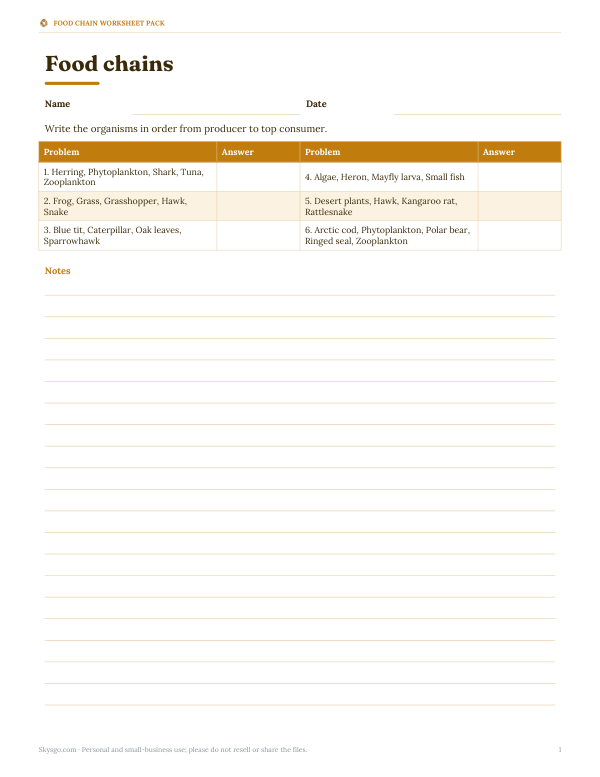
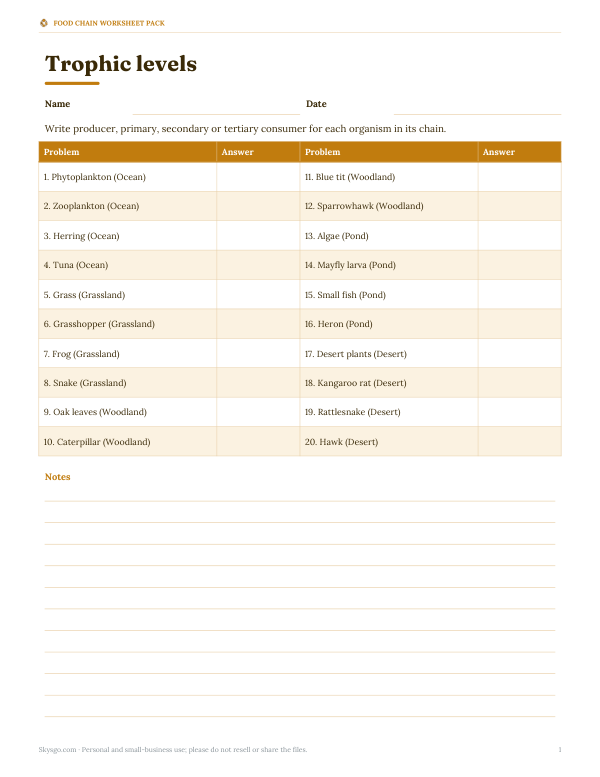
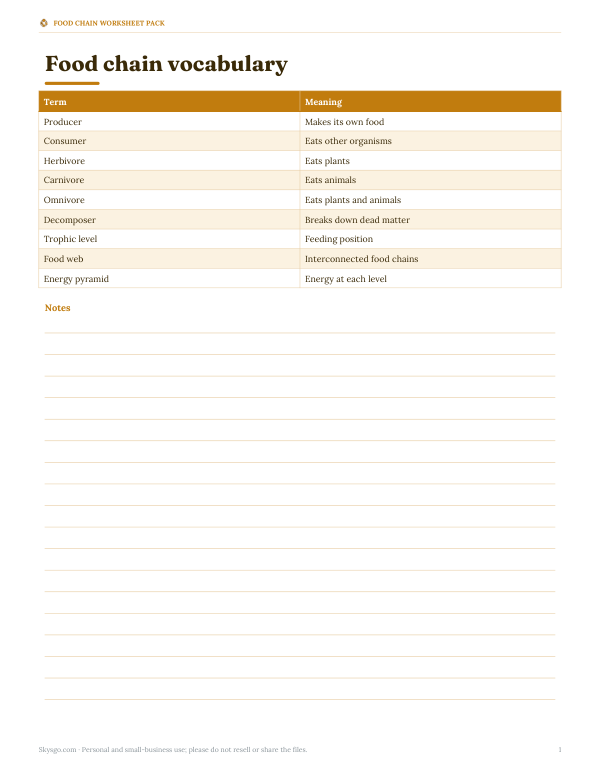
Food chain and food web maker
Food Chain Worksheet Pack
Printable food chain and food web worksheets for six ecosystems with answer keys, a trophic level vocabulary card and an energy pyramid activity.
- Ordering worksheets (PDF/DOCX)
- Trophic level quiz (PDF/DOCX)
- Vocabulary card (PDF)
- Energy pyramid (PDF/DOCX)
Formats: PDF, DOCX. Instant download after payment (link valid 72 hours, up to 5 downloads). AI-assisted: the templates were drafted with AI help and reviewed and laid out before publishing.
$3.00 USD, one-time 4 files · about $0.75 each
- Instant download
- 7-day refund
- Secure checkout by Stripe
7-day money-back guarantee. Full refund within 7 days of purchase, even after you download.
Free sample: Energy Pyramid Activity (PDF, 65 KB)
Full refund within 7 days — see the refund policy and license.
Free printables
Single sheets you can print right now, no sign-up. The full pack adds every sheet in one download plus the editable files.
 Printable Energy Pyramid Worksheet
Food chain vocabulary
| Term | Meaning | Example |
|---|---|---|
| Producer | Makes its own food, usually by photosynthesis | Grass, algae, phytoplankton |
| Primary consumer | Herbivore that eats producers | Grasshopper, zooplankton, rabbit |
| Secondary consumer | Eats primary consumers | Frog, herring, blue tit |
| Tertiary consumer | Eats secondary consumers | Snake, tuna, sparrowhawk |
| Apex predator | Top of the chain; few or no natural predators as adults | Hawk, shark, polar bear, orca |
| Decomposer | Breaks down dead material and returns nutrients | Bacteria, fungi, earthworms (detritivores) |
| Trophic level | A feeding position in the chain | Level 1 producers, level 2 herbivores … |
Food chains vs food webs
A food chain follows one path of energy, such as grass → grasshopper → frog → snake → hawk. Real ecosystems are food webs: most animals eat several foods and are eaten by several predators. A mouse, for example, might eat seeds and insects and be eaten by snakes, owls and foxes. Food webs show why ecosystems are resilient — if one food source declines, predators may switch to another — and also how a change in one species can ripple through many others.
The 10% rule and energy pyramids
At each step up a food chain, only about 10% of the energy is typically stored in the next level’s bodies; the rest is used for movement, growth, keeping warm and other life processes, or lost as heat and waste. With 10,000 kJ captured by grass, about 1,000 kJ reach grasshoppers, 100 kJ frogs, 10 kJ snakes and 1 kJ hawks. The real percentage varies (roughly 5–20%), but the pattern explains why top predators are few and need large territories, and why food chains rarely exceed four or five links.
Worked example: the ocean chain
In the ocean example, phytoplankton capture sunlight near the surface; zooplankton graze on them; herring eat the zooplankton; tuna eat herring; and sharks eat tuna. That is five trophic levels, and with 10,000 kJ at the start only about 1 kJ is left for the shark. Switching to the food web view adds krill, seals, baleen whales and orcas, showing that herring feed several predators and that krill feed both fish and the largest animals on Earth.
What happens when a link is removed?
- Remove a predator: its prey may increase sharply, then overgraze their food — a “trophic cascade”.
- Remove a producer: everything above it loses food.
- Add an invasive species: it may compete with or prey on native species.
- Pollution can build up through a chain (biomagnification), reaching the highest concentrations in top predators.
A classic case is sea otters, sea urchins and kelp: where otters decline, urchins can multiply and graze kelp forests heavily. You can type that chain into the “my own chain” option.
The six ecosystems at a glance
| Ecosystem | Main producers | Typical top predators |
|---|---|---|
| Ocean | Phytoplankton, seaweed | Sharks, orcas |
| Grassland | Grasses, wildflowers | Hawks, foxes, big cats (in savannas) |
| Woodland | Trees, shrubs, ground plants | Owls, sparrowhawks, foxes, wolves |
| Pond | Algae, pond weeds | Herons, pike |
| Desert | Cacti, shrubs, seasonal plants | Hawks, coyotes, rattlesnakes |
| Arctic | Phytoplankton, lichens, mosses | Polar bears, wolves, orcas |
Chains in the tool are simplified examples; real ecosystems contain many more species and links, and details differ between regions.
Drawing food chains correctly
- Start with a producer on the left (or at the bottom).
- Draw arrows from food to feeder — “is eaten by”.
- Use the specific name of each organism, not just “fish” or “bird”, where you can.
- Label each trophic level.
- Check every animal in the chain actually eats the one before it in that ecosystem.
Herbivores, carnivores and omnivores
Consumers are often grouped by diet. Herbivores (rabbits, caribou, zooplankton) eat producers; carnivores (hawks, sharks, polar bears) eat other animals; omnivores (many birds, bears, humans) eat both, so they appear at more than one trophic level. Scavengers such as vultures eat dead animals, and detritivores such as earthworms and woodlice break down dead plant material, working alongside decomposers.
Photosynthesis — where the energy starts
Almost every food chain begins with sunlight. Producers use light energy, carbon dioxide and water to make sugars by photosynthesis, releasing oxygen. That stored chemical energy is what passes up the chain when animals eat. A few ecosystems, such as deep-sea hydrothermal vents, instead start with bacteria that use chemical energy from minerals — a process called chemosynthesis.
Using the maker in class
- Draw the ecosystem’s chain, then switch to the web and ask which chain is missing links.
- Print the blank worksheet and have students place organisms in order.
- Use the quiz button for quick checks of trophic levels.
- Have students research a local ecosystem and type their own chain.
- Discuss where humans fit in different chains.
Privacy
Diagrams are drawn in your browser; nothing is uploaded.
Frequently asked questions
What is a food chain?
A sequence showing how energy passes from producers to consumers as organisms eat one another.
Which way do the arrows point?
From the organism that is eaten to the one that eats it — the direction energy flows.
What is the difference between a food chain and a food web?
A food web combines many interconnected food chains.
What is the 10% rule?
About 10% of energy at one trophic level typically passes to the next.
Where do decomposers fit?
They break down dead matter from every level and recycle nutrients.
Can I make my own food chain?
Yes — choose “My own chain” and type the organisms in order.
Why are food chains short?
Energy is lost at each step, so after four or five links there isn’t enough left to support another level.
Are humans in food chains?
Yes — usually as omnivores at several levels.